Adaptive Modeler Overview
Adaptive Modeler creates agent-based models for price forecasting of real-world markets such as stocks, cryptocurrencies, ETFs, commodities or forex currency pairs. One-step-ahead forecasts and trading signals are generated after every received price bar or tick. As models evolve and adapt incrementally over time, all market data (historical and current) is processed out-of-sample. Historical data is not used for repeated training, optimizing or overfitting of trading rules. Models are therefore more resilient to changing market conditions and performance is more consistent and reliable.► Model creation and configuration
► Model evolution and visualization
Model creation and configuration
Models are created mostly automatically. Some parameters can be adjusted by the user to take into account specific market characteristics such as the data fields to use (i.e. open, high, low close, bid, ask, volume), minimum price increment, transaction costs and the user's trading preferences.
Also it is possible to experiment with agent-based model settings such as the number of market participants (agents), their initial wealth and asset distribution, and evolution settings. The creation of trading rules ("genomes") can be influenced by selecting the instructions and indicators ("genes") that can be included in the trading rules. This way it is for instance possible to specify what type of orders agents can place and which predefined technical indicators they can use.
Models can also include data of other input variables to be used by agents. This can be any data that could be helpful for forecasting such as fundamental data, economic indicators, other price series or technical indicators. Up to 100 additional custom input variables can be included per model.
Model evolution and visualization
Model evolution is visualized in real-time and can be paused and resumed by the user at any time. Also it is possible to advance the model step-by-step.
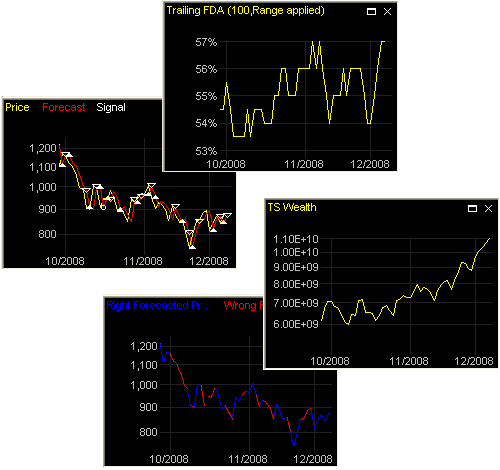
Adaptive Modeler provides an extensive set of output data and visualization tools including live charts to observe historical and real-time model evolution and the quality of previous forecasts and trading signals. For instance, the Forecast Directional Accuracy (FDA) is an indicator that counts the percentage of bars for which the forecasted price change was in the right direction.
Another useful indicator is the Right/Wrong Forecasted Price Changes which shows the price changes for which the direction was forecasted correct in blue and those for which the direction was forecasted wrong in red. This not only visualizes the number of bars forecasted right and wrong but also the magnitude of those price changes.
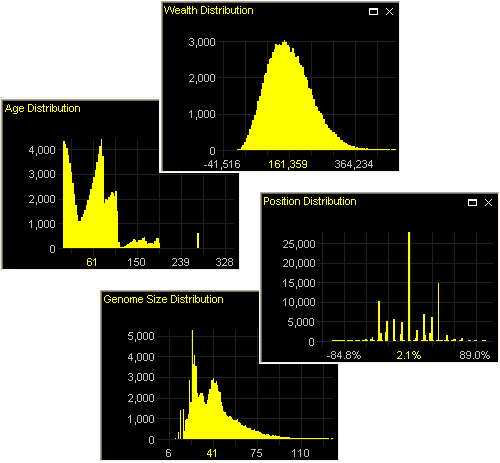
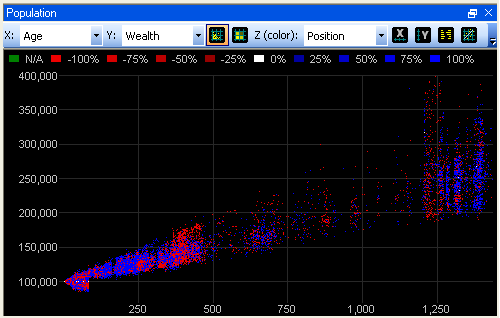
Further insight in what is happening inside the agent-based model can be obtained through various histograms that show distributions of agent values such as their wealth, returns, position, age and others.
The agent population can also be visualized multi-dimensionally in
scatter plots of multiple agent values to identify relationships between
different values and to gain an understanding of the particular dynamics
of a model. All these visualization tools are updated in real-time.
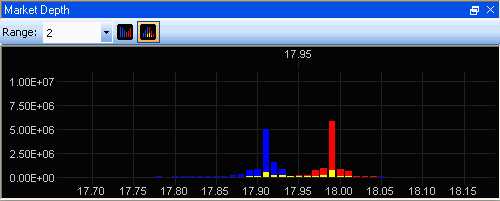
The Virtual Market pricing mechanism can be visualized in detail with the Market Depth window which show the depth of the orderbook before or after clearing. Blue bars represent buy volume, red bars represent sell volume and yellow represents buy and sell volume at the same price.
Trading simulator
Adaptive Modeler contains a Trading Simulator to simulate trading based on the trading signals. This makes it possible to see what returns would have been made when the suggested trades were actually executed. Trading can be simulated according to user customizable trading parameters such as enabling/disabling short positions, closing positions at end of day, transaction costs and expected spread and slippage.
Using Historical Simulation or Monte Carlo Simulation it is also possible to
project the expected distribution of future trading returns based on
given expectations for Forecast Directional Accuracy, volatility
and other factors.
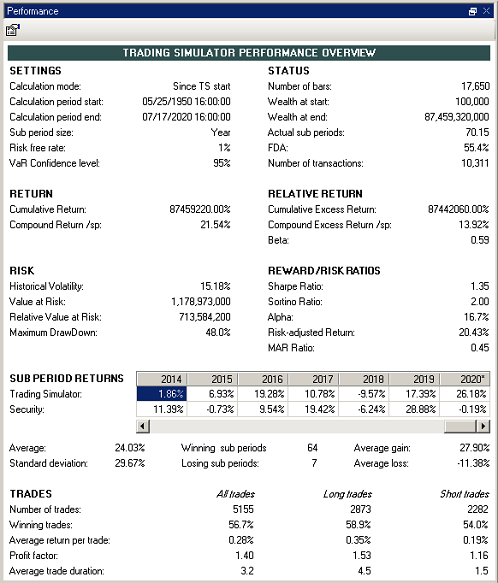
Performance analysis
Extensive performance analysis is provided with risk and return indicators of the Trading Simulator including Alpha, Beta, Sharpe and Sortino ratios, Value at Risk and risk-adjusted return.
Performance can be calculated over any specific period or can be calculated over a trailing number of periods (i.e. 10 years or 3 months). Sub period returns and statistics (i.e. per year, quarter, month, week, etc.) can also be reported. Compound returns can be expressed in any of these periods. Also typical trades statistics such as the number of long/short trades, winning trades%, average return per trade and Profit Factor are available.
The risk-free rate and a confidence level can be set for indicators such as Sharpe ratio, Alpha, Value at Risk and risk-adjusted return.
All return calculations and derived indicators in Adaptive Modeler are calculated after all transaction costs (broker commissions, spread and slippage).
Key Features
- easy to use drag-and-drop user interface
- real-time charts and plots to visualize model evolution, behavior and performance
- user configurable genetic programming engine for trading rule creation
- supports quote intervals ranging from 1 millisecond to multiple days or variable for constant range bars or high-frequency tick data
- support for up to 100 custom input variables
- Trading Simulator with hedge-fund style performance overview with various risk & return indicators (i.e. beta, alpha, Sharpe ratio, Sortino ratio, VaR) and sub period and trades statistics
- data exporting
- batch jobs and command line automation
- includes User's Guide, Tutorial, context-sensitive help and examples
For more feature details, see the extensive feature list.